Beywatch Meta Report
August 2026 Beyblade X Meta Report
The complete month: every reported tournament top cut from August 1 to August 31, and what those 542 decks say about the blades and combinations shaping competitive Beyblade X.
Four takeaways
01 · The most common blade
Shark Scale appeared in 63.5% of reported August top-cut decks and in 69.6% of 1st-place results.
02 · The month's biggest swings
Glory Valkyrie gained the most usage, +14.1 pts versus July, while Phoenix Wing gave up the most at −5.4 pts.
03 · The most repeated full build
Wizard Rod 1-60H reached the reported top cut 185 times, finishing 1st in 35.7% of those appearances.
Most-used blades
Share of reported August top-cut decks containing each blade





Movers: what rose and fell since July
Change in share of top-cut decks, July versus August, in percentage points. Both columns share one scale, so a gain and a loss are the same length when they are the same size. Blades need at least 10 appearances in one of the two months.
Gained usage





Lost usage




Weekly trajectory
Weekly share of top-cut decks from Jul 1 to Aug 31 for the 12 blades that gained or lost the most usage. Every value is listed in the table below the chart.
Weekly numbers as a table
| Blade | Jul 1 | Jul 8 | Jul 15 | Jul 22 | Jul 29 | Aug 5 | Aug 12 | Aug 19 | Aug 26 |
|---|---|---|---|---|---|---|---|---|---|
| Glory Valkyrie | 0% | 0% | 0% | 7% | 14% | 18% | 21% | 19% | 14% |
| Bullet Griffon | 4% | 5% | 2% | 4% | 12% | 9% | 9% | 8% | 9% |
| Dran Strike | 10% | 7% | 8% | 14% | 11% | 15% | 13% | 16% | 13% |
| Heavens Ring | 1% | 1% | 0% | 1% | 2% | 2% | 2% | 5% | 8% |
| Silver Wolf | 14% | 8% | 14% | 22% | 13% | 19% | 15% | 13% | 19% |
| Shark Edge | 0% | 1% | 1% | 1% | 2% | 1% | 1% | 2% | 4% |
| Phoenix Wing | 11% | 17% | 7% | 19% | 13% | 6% | 7% | 13% | 10% |
| Meteor Dragoon | 16% | 16% | 13% | 23% | 16% | 15% | 20% | 12% | 6% |
| Golem Rock | 9% | 3% | 8% | 12% | 5% | 7% | 3% | 4% | 2% |
| Hover Wyvern | 14% | 18% | 13% | 20% | 13% | 13% | 9% | 20% | 10% |
| Wizard Rod | 54% | 68% | 60% | 65% | 55% | 56% | 65% | 61% | 55% |
| Aero Pegasus | 25% | 31% | 36% | 28% | 32% | 27% | 26% | 28% | 30% |
Each cell is the share of that week's reported top-cut decks containing the blade.
Full builds appearing most often
Equivalent basic Lock Chips are combined; builds are ranked by August top-cut appearances


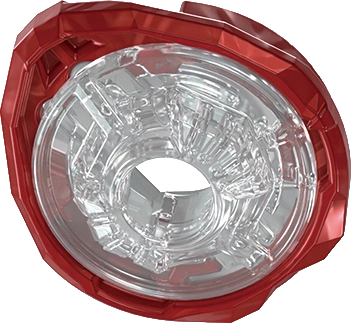


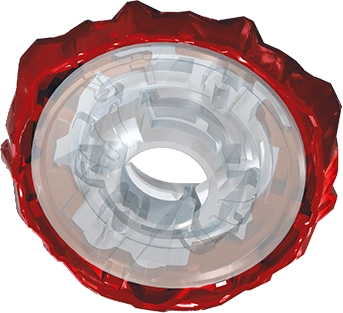

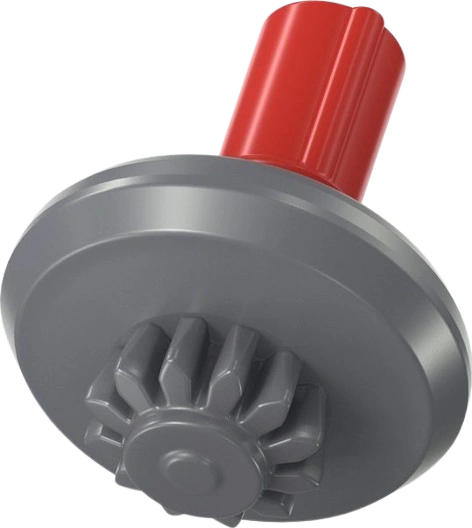
Ratchets and bits behind them
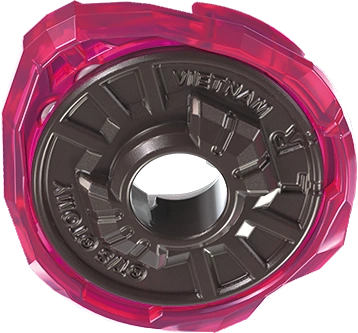
Share of August top-cut decks using each supporting part



Where the results came from
The report covers 185 events and 542 reported top-cut decks, measured against 156 events in July. Regional filters remain available on every live ranking page; this snapshot combines the full global dataset.
How to read this report
Tournament sources generally publish the top finishers and their decks, not every individual battle. “Usage” therefore means the share of reported top-cut decks containing a part. “1st rate” means how often an appearance in that reported top cut finished 1st. A “mover” is the change in that usage share between July and August, written in percentage points. This is evidence about the competitive field, not a guarantee that one build wins a particular matchup.
August is closed and this report is final: it covers the whole month, and the numbers above will only move if a late result is added to a August event. For September and beyond, follow the live combo rankings, where every ranking can be filtered by region, ruleset and format.